Abstract
By Andrew Page based on version 3.11.2 (22-Jan-2018)
Roary is a high speed stand alone pan genome pipeline, which takes annotated assemblies in GFF3 format (produced by Prokka (Seemann, 2014)) and calculates the pan genome. Using a standard desktop PC, it can analyse datasets with thousands of samples, something which is computationally infeasible with existing methods, without compromising the quality of the results. 128 samples can be analysed in under 1 hour using 1 GB of RAM and a single processor. To perform this analysis using existing methods would take weeks and hundreds of GB of RAM. Roary is not intended for meta-genomics or for comparing extremely diverse sets of genomes.
Citation and further details of the method
Andrew J. Page, Carla A. Cummins, Martin Hunt, Vanessa K. Wong, Sandra Reuter, Matthew T. G. Holden, Maria Fookes, Daniel Falush, Jacqueline A. Keane, Julian Parkhill, "Roary: Rapid large-scale prokaryote pan genome analysis", Bioinformatics, 2015;31(22):3691-3693 doi:10.1093/bioinformatics/btv421
Step by step tutorial
The Microbial Genomics Lab at CBIB have put together an excellent step by step tutorial on using Roary.
Installation instructions
Details on how to install Roary.
Input files
Roary takes GFF3 files as input. They must contain the nucleotide sequence at the end of the file.
Input files from Prokka
All GFF3 files created by Prokka are valid with Roary and this is the recommended way of generating the input files. Each input file should have a unique locus tag for the gene IDs (--locustag) to make it easier for you to identify where genes came from.
Input files from GenBank
On NCBI's website, GFF3 files only contain annotation and not the nucleotide sequence so cannot be used. You need to download the GenBank files plus nucleotide sequence and convert them. When downloading, click on the show sequence option, Update View then Send to a File of type GenBank. You can then use the Bio::Perl script bp_genbank2gff3.pl to convert to GFF3. Just be aware that mixing different gene prediction methods and annotation pipelines can give noisier results.
Alternatively you can use ncbi-genome-download to pull down the FASTA files and convert them to GFF3 with Prokka.
Software usage
To run the software and create a pan genome you use the roary script. It takes in GFF files and outputs various analysis.
roary
Usage:   roary [options] *.gff

Options: -p INT    number of threads [1]
         -o STR    clusters output filename [clustered_proteins]
         -f STR    output directory [.]
         -e        create a multiFASTA alignment of core genes using PRANK
         -n        fast core gene alignment with MAFFT, use with -e
         -i        minimum percentage identity for blastp [95]
         -cd FLOAT percentage of isolates a gene must be in to be core [99]
         -qc       generate QC report with Kraken
         -k STR    path to Kraken database for QC, use with -qc
         -a        check dependancies and print versions
         -b STR    blastp executable [blastp]
         -c STR    mcl executable [mcl]
         -d STR    mcxdeblast executable [mcxdeblast]
         -g INT    maximum number of clusters [50000]
         -m STR    makeblastdb executable [makeblastdb]
         -r        create R plots, requires R and ggplot2
         -s        dont split paralogs
         -t INT    translation table [11]
         -ap       allow paralogs in core alignment
         -z        dont delete intermediate files
         -v        verbose output to STDOUT
         -w        print version and exit
         -y        add gene inference information to spreadsheet, doesnt work with -e
         -iv STR   Change the MCL inflation value [1.5]
         -h        this help message
Default usage – create a pan genome without a core alignment
roary *.gff
Quickly generate a core gene alignment using 8 threads:
roary -e --mafft -p 8 *.gff
Save results to a different directory:
roary –f output_dir *.gff
Change the minimum blastp percentage identity. ' not advised to go below 90% unless you know what you're doing.
roary –i 90 *.gff
Run a QC check to see if all the samples are what you think they are
roary –qc –k /path/to/kraken/db *.gff
don't split clusters containing paralogs
roary -s *.gff
Check that the software is installed correctly.
roary -a
query_pan_genome
Perform set operations on the pan genome to see the gene differences between groups of isolates.
Options: -g STR    groups filename [clustered_proteins]
         -a STR    action (union/intersection/complement/gene_multifasta/difference) [union]
         -c FLOAT  percentage of isolates a gene must be in to be core [99]
         -o STR    output filename [pan_genome_results]
         -n STR    comma separated list of gene names for use with gene_multifasta action
         -i STR    comma separated list of filenames, comparison set one
         -t STR    comma separated list of filenames, comparison set two
         -v        verbose output to STDOUT
         -h        this help message
Union of genes found in isolates
query_pan_genome -a union *.gff
Intersection of genes found in isolates (core genes)
query_pan_genome -a intersection *.gff
Complement of genes found in isolates (accessory genes)
query_pan_genome -a complement *.gff
Extract the sequence of each gene listed and create multi-FASTA files
query_pan_genome -a gene_multifasta -n gryA,mecA,abc *.gff
Gene differences between sets of isolates
query_pan_genome -a difference --input_set_one 1.gff,2.gff --input_set_two 3.gff,4.gff,5.gff
iterative_cdhit
Iteratively cluster a FASTA file of proteins with CD-hit, lower the threshold each time and extracting core genes (1 per isolate) to another file, and remove them from the input proteins file.
Required arguments:
         -m STR   input FASTA file of protein sequences [_combined_files]

Options: -p INT   number of threads [1]
         -n INT   number of isolates [1]
         -c STR   cd-hit output filename [_clustered]
         -f STR   output filename for filtered sequences [_clustered_filtered.fa]
         -l FLOAT lower bound percentage identity [98.0]
         -u FLOAT upper bound percentage identity [99.0]
         -s FLOAT step size for percentage identity [0.5]
         -v       verbose output to STDOUT
         -h       this help message
Pan-genome wide association studies
Ola Brynildsrud has created a python script called scoary which takes in a csv file of traits, and the gene presence and absense spreadsheet, then performs a pan genome wide association analysis. It highlights genes which appear to be linked to the traits and gives lots of stats.
Visualising results
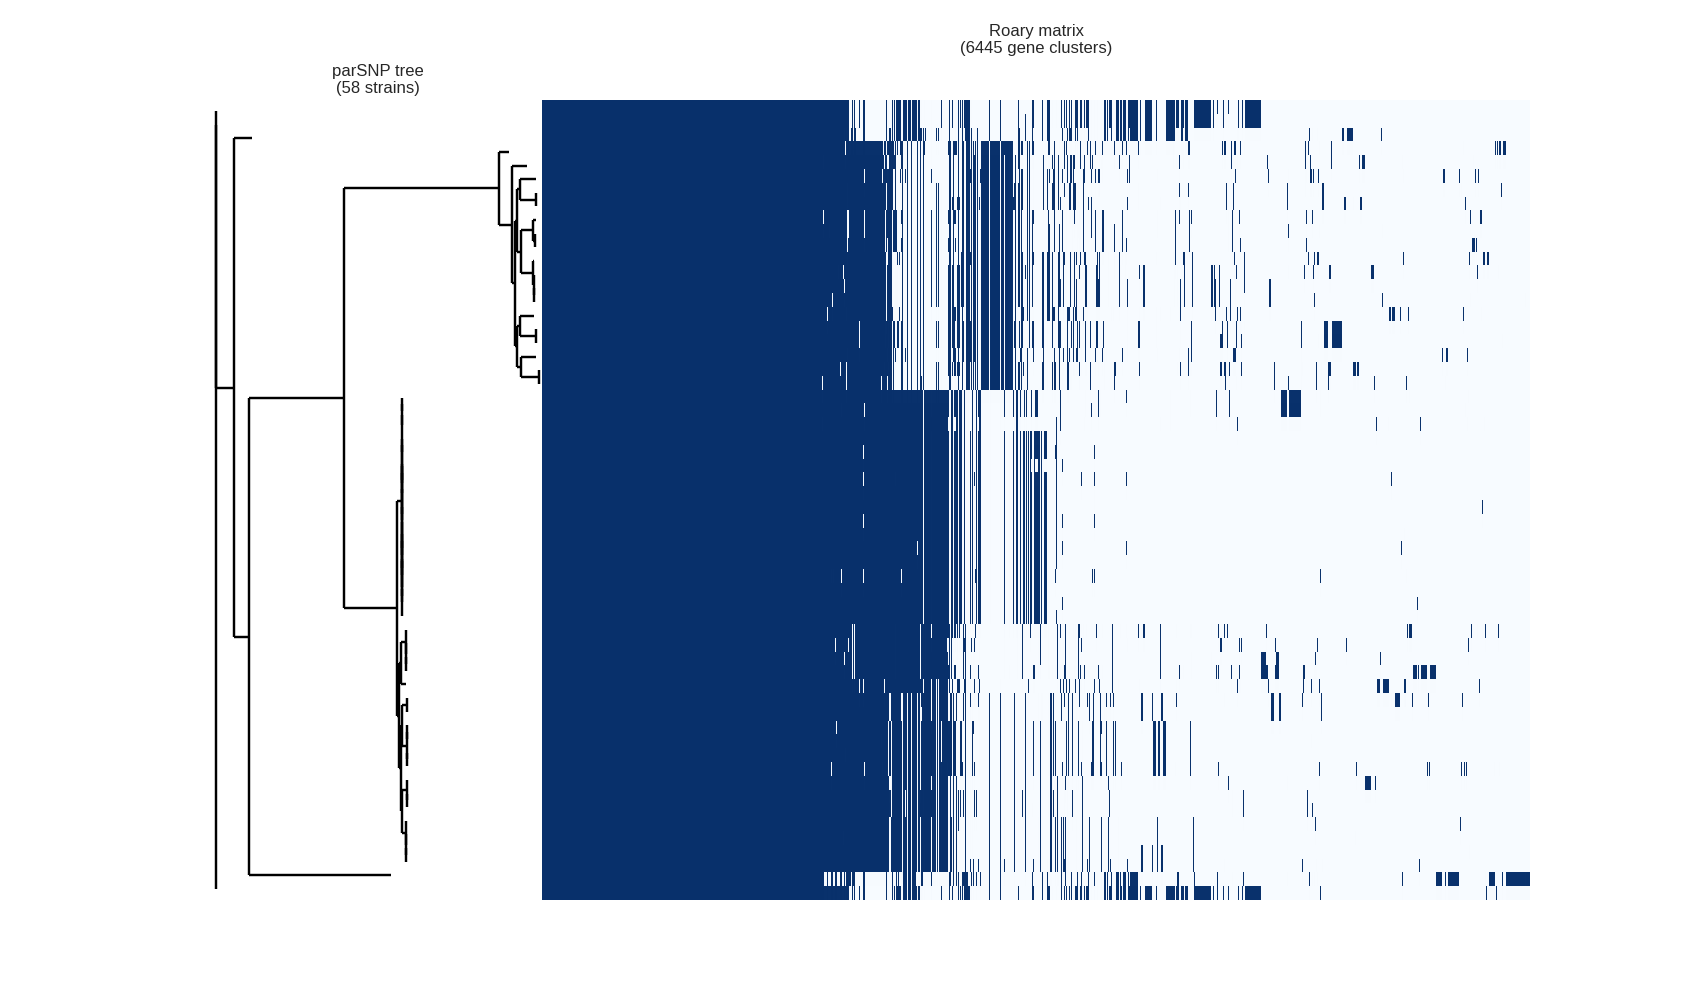
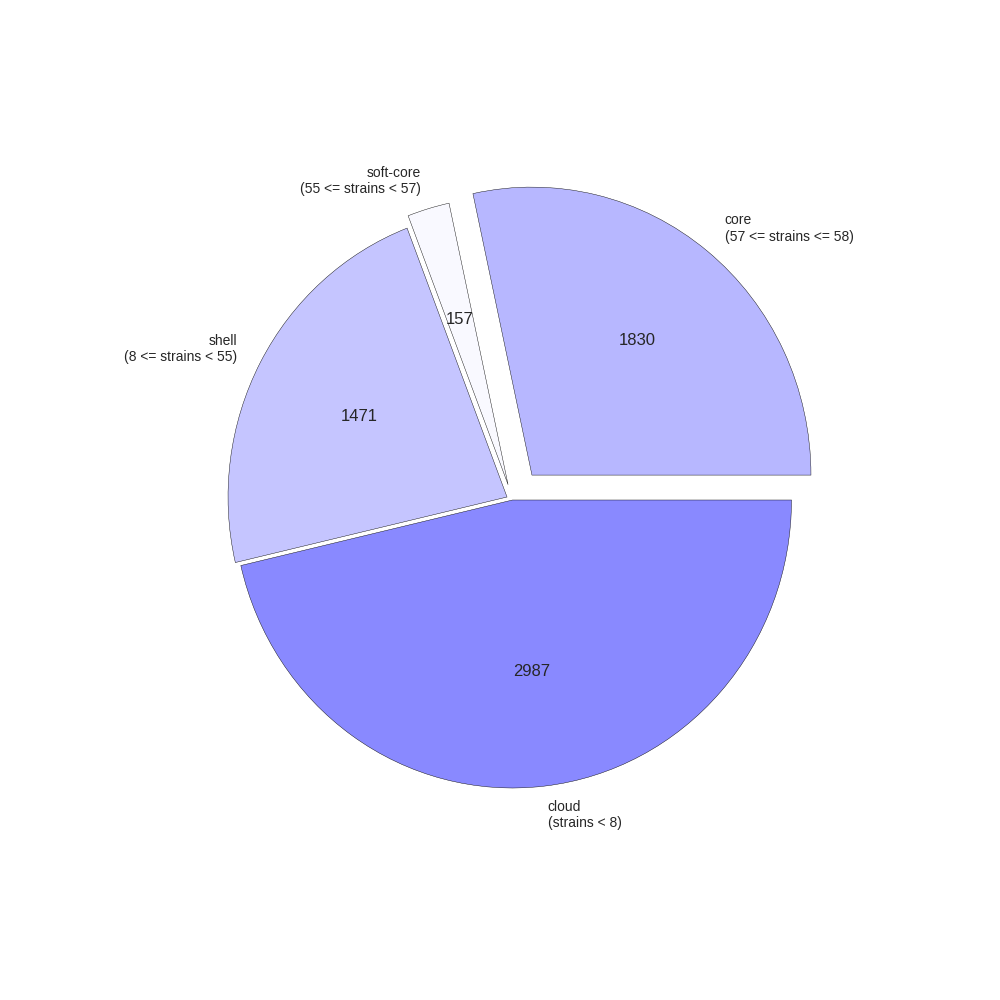
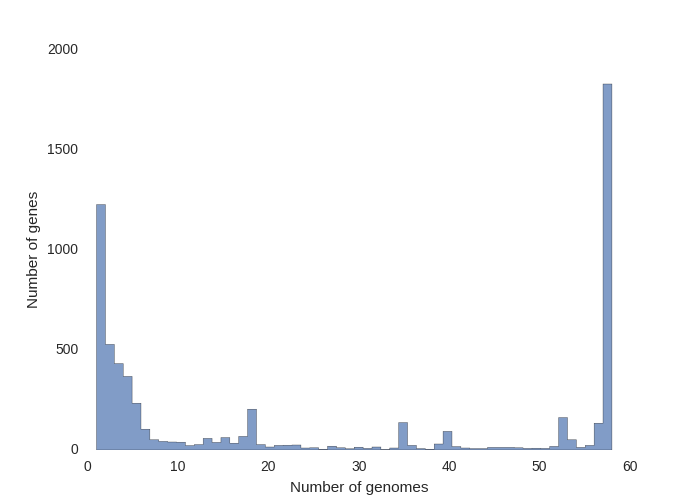
roary_plots.py
This contributed script by Marco Galardini is not installed by default but can be very useful. Additional details can be found here in the repository. It provides 3 figures, showing the tree compared to a matrix with the presence and absence of core and accessory genes. The next is an pie chart of the breakdown of genes and the number of isolate they are present in. And finally there is a graph with the frequency of genes versus the number of genomes.
roary_plots.py name_of_your_newick_tree_file.tre gene_presence_absence.csv
Interactive visualisation with Phandango
James Hadfield has produced the Phandango website which allows for interactive visualisation of the output of Roary. You can drag and drop the results into your web browser, then interactively play around with the data. There is an example data set from Roary on the website.
Interactive visualisation with FriPan
David Powell has produced the FriPan website which allows for interactive visualisation of the output of Roary. Jason Kwong has created a converter script to transform the output of Roary into a suitable format for FriPan.
PanVizGenerator
Thomas Lin Pedersen has created an R package which allows for some excellent visualisation of the output of Roary called PanVizGenerator. He also has alternative pan genome software called FindMyFriends. Both are part of BioConductor.
panX
panX can use the output of roary as input to their excellent visualisation tool.
Roary2SVG
Torsten Seemann has contributed a script called roary2svg.pl which will produce a nice figure with the gene presence and absence of each sample, plus a count of genes.
Receipe for using Roary
- Annotate FASTA files with PROKKA
- Roary –e –mafft *.gff
- FastTree –nt –gtr core_gene_alignment.aln > my_tree.newick
Output files
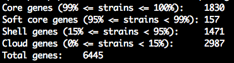
summary_statistics.txt
Number of genes in the core and accessory. A text file with an overview of the genes and how frequently they occur in the input isolates. If the number of core genes is 0 it can indicate you have some contamination. Likewise if the total number of genes is very high.
gene_presence_absence.csv
The gene presence and absence spreadsheet lists each gene and which samples it is present in. The view below shows how it looks in Excel.
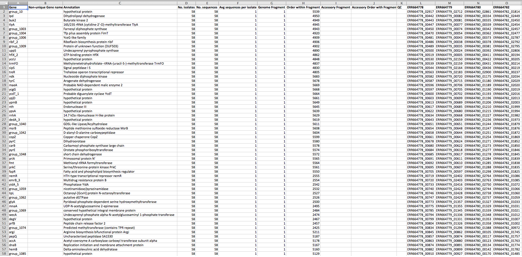
- The gene name, which is the most frequently occurring gene name from the sequences in the cluster. If there is no gene name, then it is given a generic unique name group_XXX.
- A non unique gene name, where sequences with the same gene name have ended up in different groups. It might be because of split genes, or miss annotation.
- Functional annotation. The most frequently occurring functional annotation from the cluster is used.
- Number of isolates represented in the cluster.
- Number of sequences in the cluster.
- Average number of sequences per isolate. This is normally 1. If this is greater than 1 then there is over clustering and the paralogs couldn’t be split.
- Genome fragment, where there is evidence at the contig level that the genes are linked.
- Order within fragment, combined with the genome fragment this gives an indication of the order of genes within the graph. In Excel, sort on Column G and H.
- Accessory Fragment is where core genes are excluded and there is evidence at contig level that the genes are linked.
- Accessory order with fragment, combined with the Accessory fragment this gives an indication of the order of genes within the accessory graph. In Excel, sort on columns I and J.
- Comments on the quality of the cluster. Miss predictions are noted, as are single genes on single contigs, which can be evidence of low level contamination.
- Minimum sequence length in nucleotides of the cluster.
- Maximum sequence length in nucleotides of the cluster.
- Average sequence length in nucleotides of the cluster.
- Presence and absence of genes in each sample, with the corresponding source Gene ID.
gene_presence_absence.Rtab
This file is similar to the gene_presence_absence.csv file, however it just contains a simple tab delimited binary matrix with the presence and absence of each gene in each sample. It can be easily loaded into R using the read.table function, which opens up a world of powerful tools. The first row is the header containing the name of each sample, and the first column contains the gene name. A 1 indicates the gene is present in the sample, a 0 indicates it is absent.
pan_genome_reference.fa
This is a FASTA file which contains a single representative nucleotide sequence from each of the clusters in the pan genome (core and accessory). The name of each sequence is the source sequence ID followed by the cluster it came from. This file can be of use for reference guided assembly, whole genome MLST or for mapping raw reads to it.
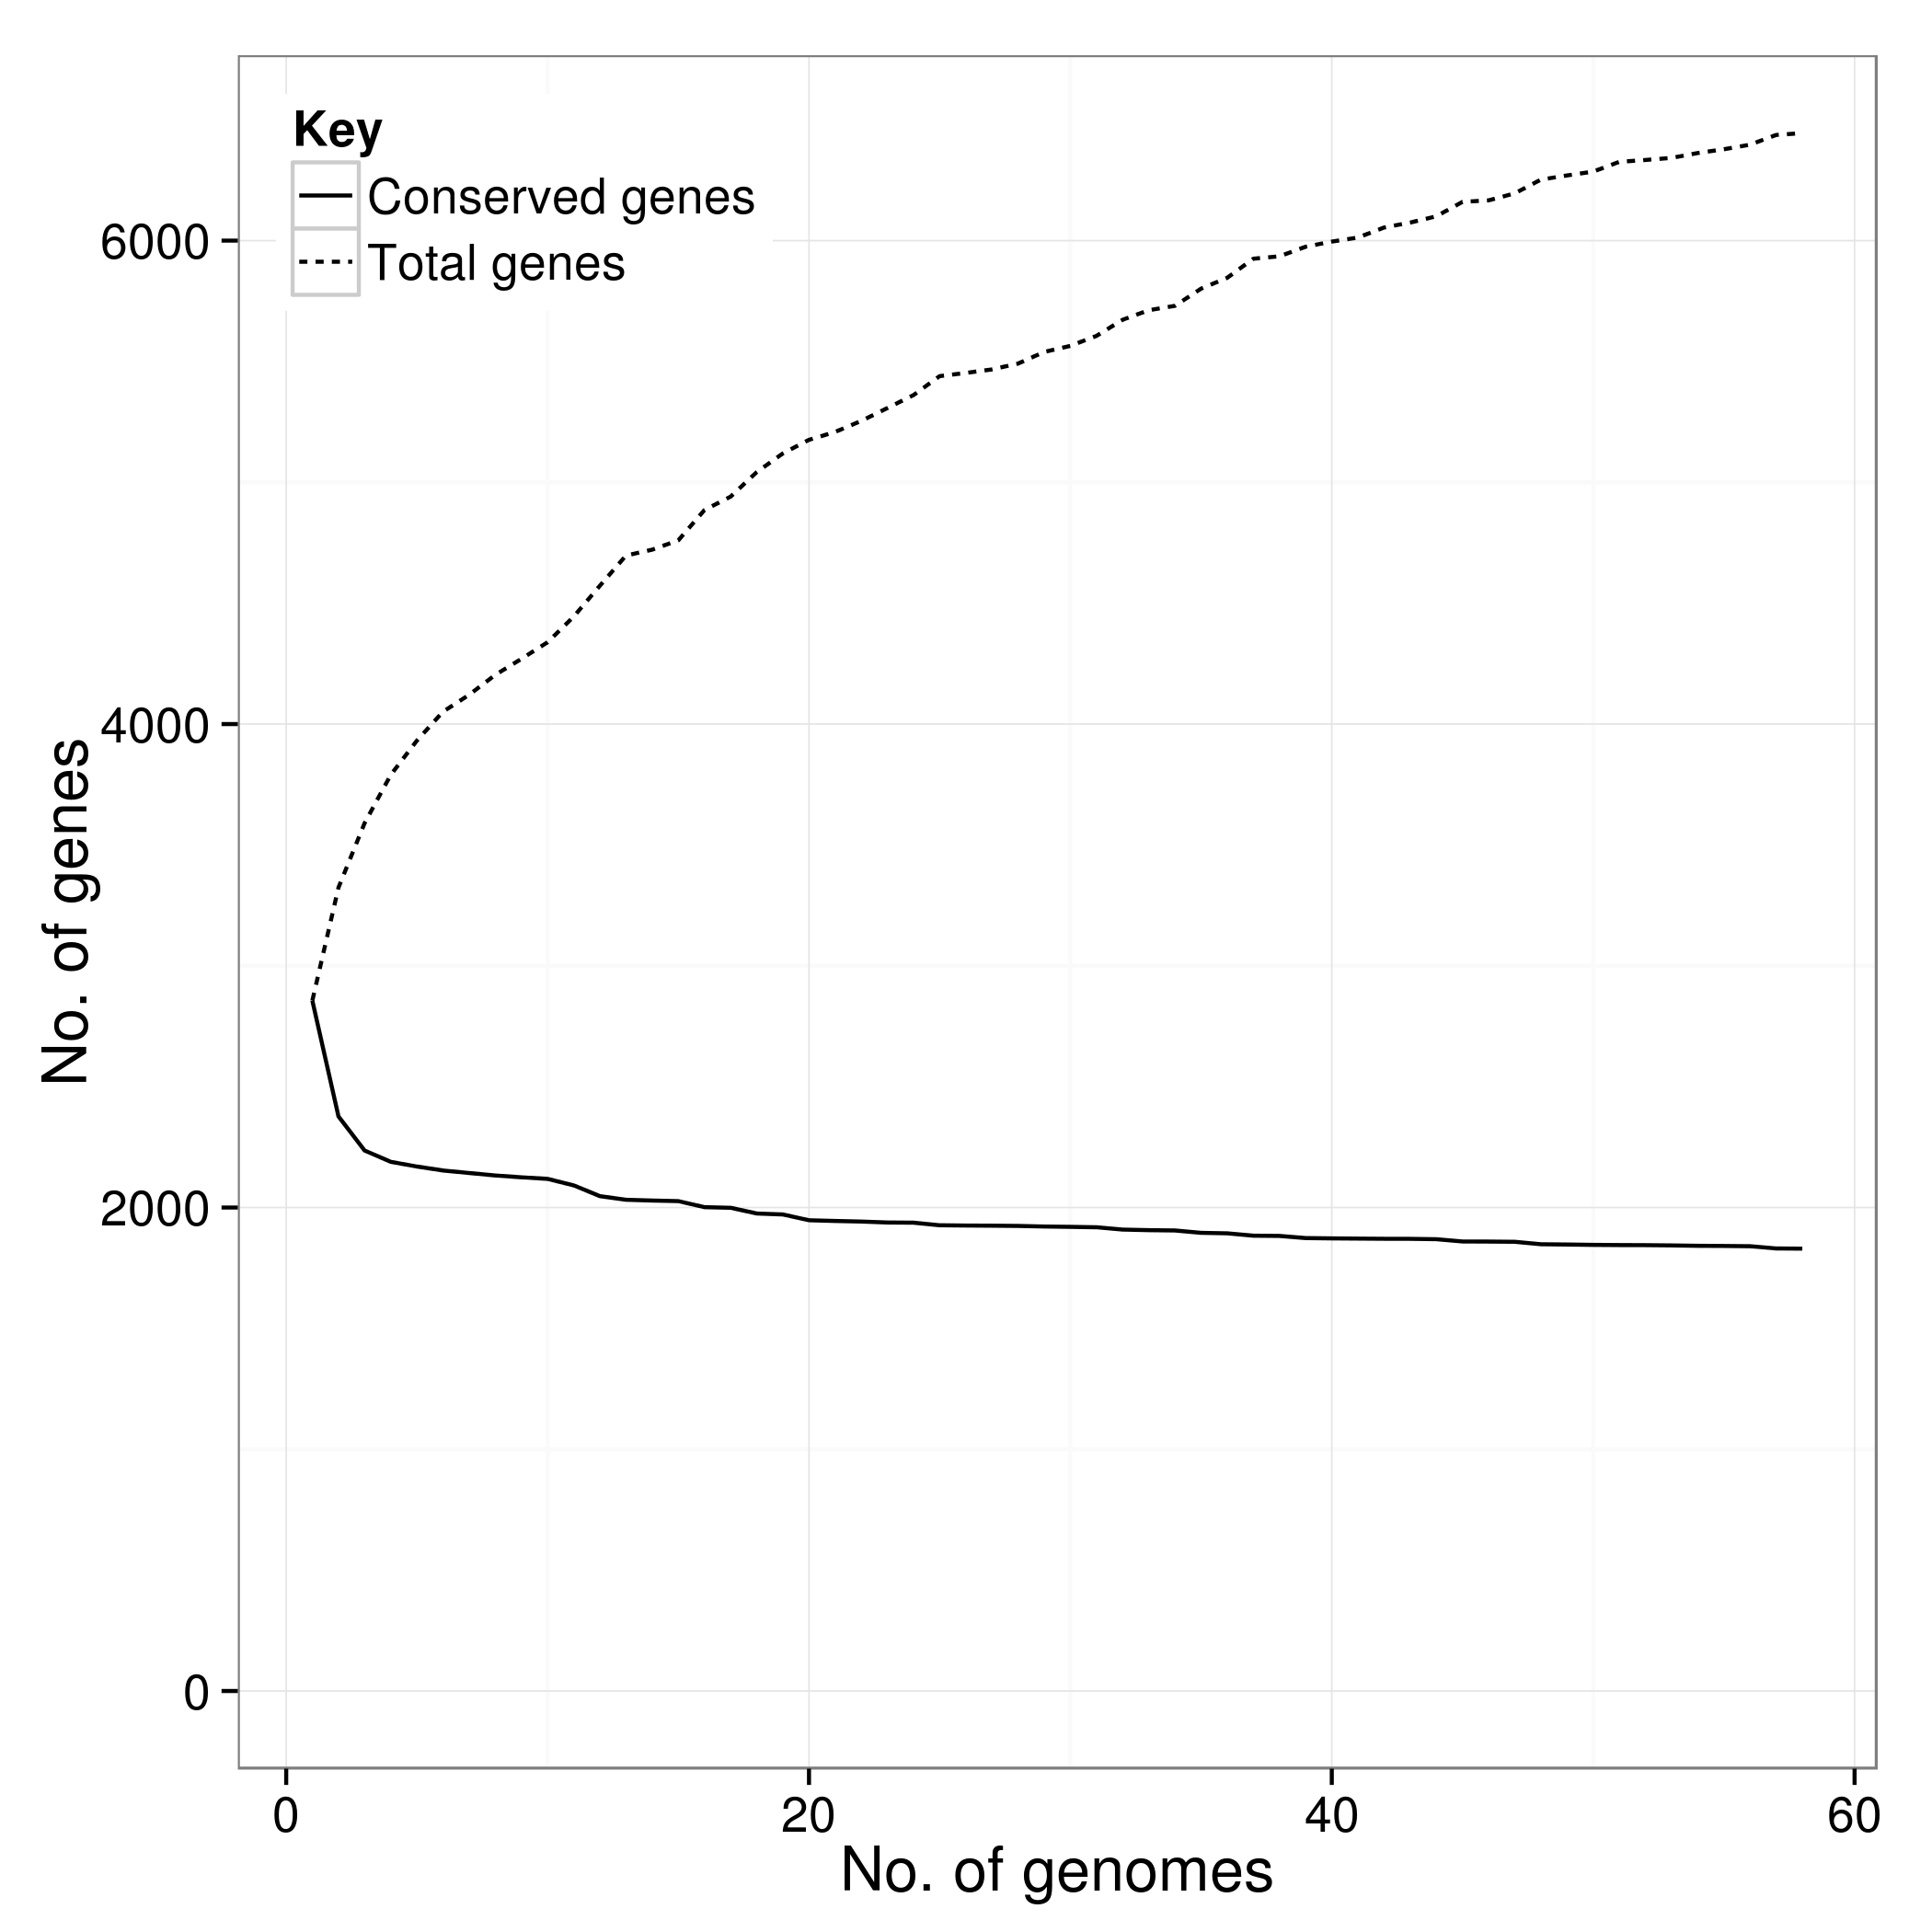
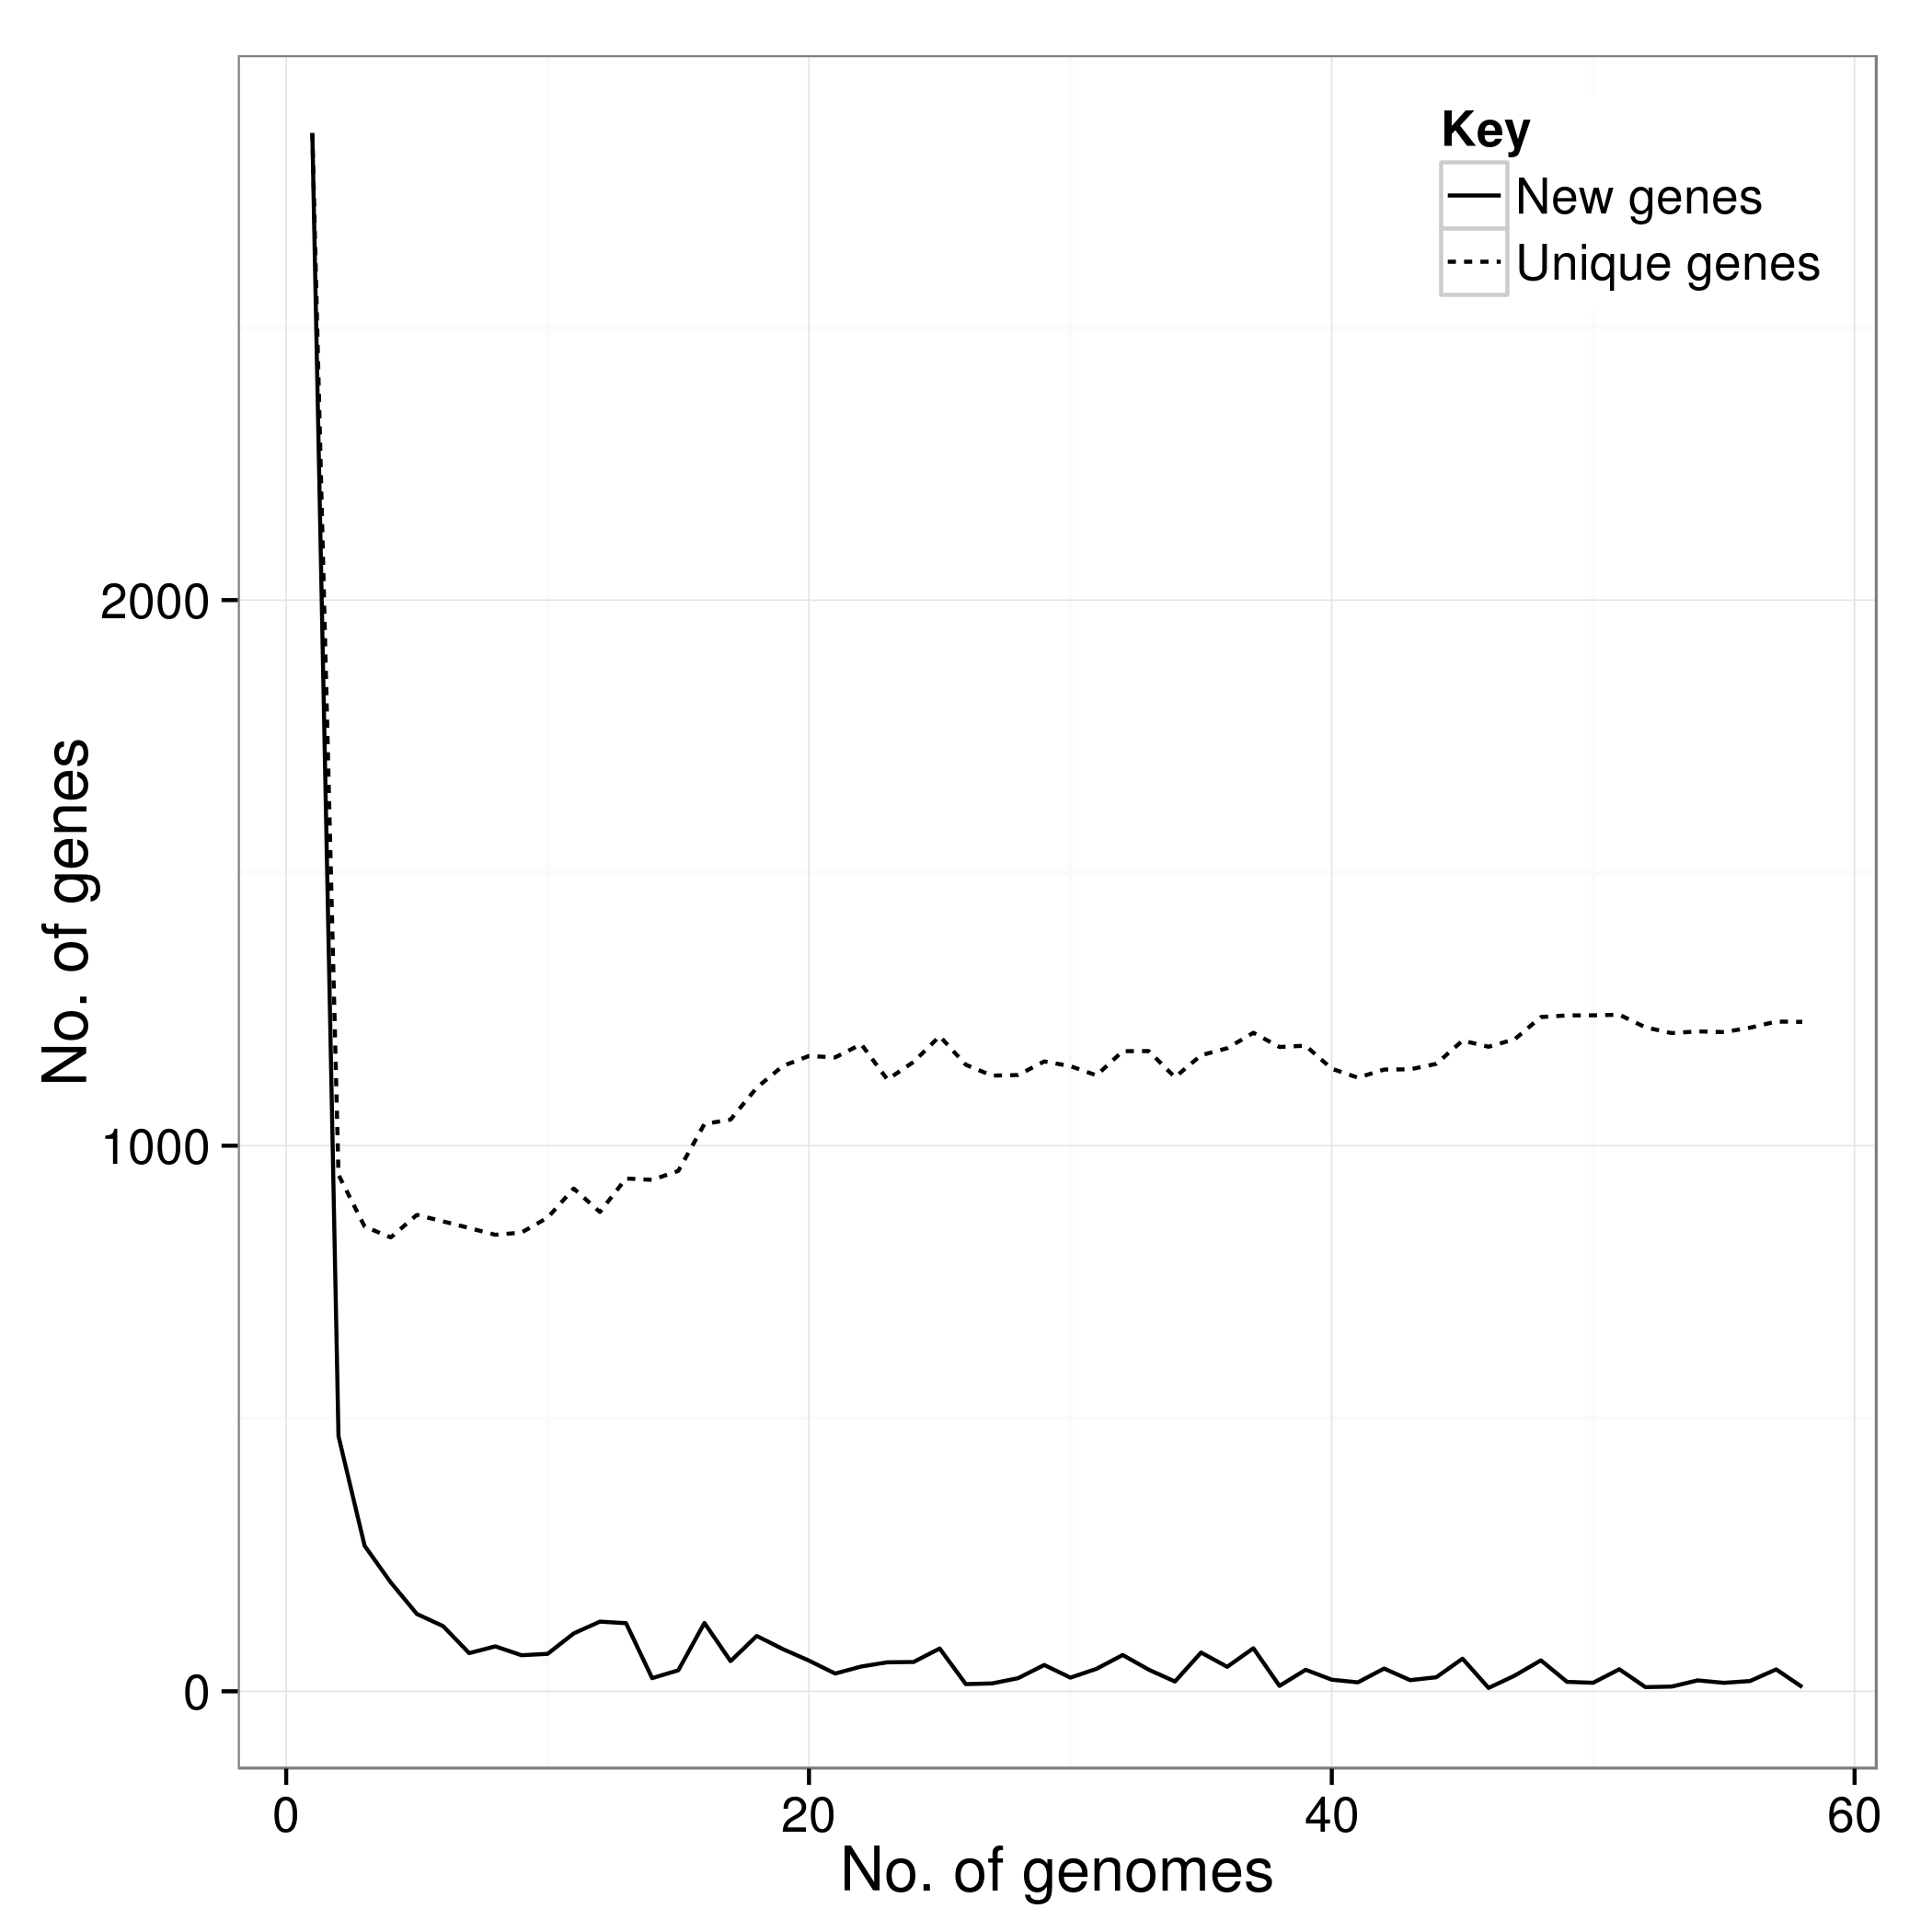
*.Rtab
There is an additional script called create_pan_genome_plots.R which requires R and the ggplot2 library. It takes in the *.Rtab files and produces graphs on how the pan genome varies as genomes are added (in random orders).
accessory_binary_genes.fa.newick
This is a tree created using the binary presence and absence of accessory genes. It is in Newick format and can be viewed in FigTree. It is only a quick and dirty tree to roughly group isolates together based on their accessory genome and is in no way reliable other than to give a quick insight into the data. If you want a more accurate tree you need to use the core gene alignment as your starting point.
accessory_graph.dot
A graph in DOT format of how genes are linked together at the contig level in the accessory genome. You can view it using Gephi. Nodes correspond to genes. An edge represents where two genes are next to each other on any of the input assemblies. To generate the weights on the edges, a count is kept of the frequency of the genes being beside each other, they are then weighted by the overall clustering of the accessory binary presence and absense (to reduce bias by over represented genotypes), then inverted.
core_accessory_graph.dot
A graph in DOT format of how genes are linked together at the contig level in the pan genome. You can view it using Gephi.
clustered_proteins
Groups file where each line lists the sequences in a cluster.
core_gene_alignment.aln
If you pass in the -e parameter to roary, a multi-FASTA alignment of all of the core genes is created. By default it uses PRANK (Löytynoja, 2014) which performs a codon aware alignment. It is slow but accurate. If you pass in -e --mafft it will use MAFFT which performs a nucleotide alignment. It is very fast but less accurate. This can then be used as input to build a phylogenetic tree. To reduce the memory and run time, you can pre filter the alignment using snp_sites. Just be aware that recombination is not taken care of with this method.
Software availability
All of the source code is available under the GNU GPL 3 open source license from: https://github.com/sanger-pathogens/Roary
Feedback/Issues
We currently do not have the resources to provide support for Roary. However, the community might be able to help you out if you report any issues about usage of the software to the issues page.
FAQ
Below is a list of some questions that we have been asked.
Strange errors
Check the dependencies with roary -a. If theres something missing, then you’ll need to install it.
The installation didnt work, what do I do?
Please follow the installation instructions that are appropriate for the system you are working on. Then check the dependencies with roary -a. If theres something missing, then you’ll need to install it. Failing that please contact your IT system administrator or someone with computing knowledge in your organisation because they are best placed to assist you. If you think there is a bug in the software please file an issue on github with a detailed example of your input and the error output, or if you have fixed it yourself send us a pull request.
I ignored your installation instructions and now your software doesn't work
We recommend you install dependancies using the recommended methods (bioconda/apt) because they can be a pain to install manually. If you ignore this advice, we assume you are a super advanced system administrator who can figure all this stuff out for themselves, so don't need any help from us.
Gubbins, detecting recombinatioin in pan genomes
You cannot use the output of Roary as the input to Gubbins (e.g. to detect recombination in the pan genome). They are fundamentally incompatible (at a theoretical level). Jukka Corander has suggested BratNextGen will work.
I got no core genes?
Usually this means there is contamination, where one of your samples is from a different unrelated species. If you have Kraken (Wood and Salzberg, 2014) installed, you can run a Kraken QC check with —qc –k /path/to/kraken/db. This will produce report which will list the top species for each sample. Another quick way is to simply look at the size of your input files. If some are way too big or way too small, they might be a different species or partial assemblies. If assemblies are extremely fragmented (thousands of contigs), genes may be too fragmented to do anything with.
Why do identical sequences (paralogs) end up in different clusters/genes?
One of the big selling points of Roary is that it tries by default to detect paralogs and split them. It looks at the sytany (genes around your gene of interest) to split paralogs into the most appropriate cluster. This can result in identical sequences ending up in different clusters/genes. You can turn off paralog splitting by providing the '-s' option. By default any cluster containing paralogous genes gets filtered out of the final core gene alignment. You can force roary to output a representative sequence for each paralogous gene by providing the option '-ap'.
The core is a lot smaller than I expected?
With bacteria, the rule of thumb is that there are about 1,000 genes per million bases. If you have a 2 megabase genome and are getting a core of 200 genes, instead of closer to 2,000 genes, then there is a problem. The species could be too diverse, in which case you should lower the blastp percentage identity (-i 90). Just be aware that you can get anything to cluster with anything else if you set this value low enough, but the results will be complete rubbish. If you are setting this below 70%, then you're doing something wrong. Other causes are contamination from a different species, or very poor assemblies (too small, too fragmented), see I got no core genes.
No core alignment is produced and theres an error about too many clusters?
By default if there are more than 50,000 clusters, Roary will not create the core alignment. In virtually every case, having more than 50,000 clusters is a result of mixing different unrelated species and you should go back and QC your samples. In some limited cases (e.g. E. coli) you can increase the maximum number of allowed clusters by using the –g parameter (-g 60000). More clusters will mean a longer running time, and a lot more RAM usage.
Why do the results vary with the same input files?
Building pan genomes is NP-hard. Roary addresses this with a non deterministic heuristic. This means there will be a bit of variation in the results if you run it multiple times. It's fundamentally difficult and if we were not using a heuristic, it would potentially take millions/billions of years to run the program.
How was the accessory binary tree built?
To provide a quick insight into the data we build a quick and dirty tree based on the accessory genome. First of all we construct a FASTA file with the binary presence and absence of genes, where 'A' means a gene is present and 'C' means it is absent. Only the first 4000 genes in the accessory genome are considered to limit the running time and memory usage of FastTree. FastTree is then run with the fastest possible settings to produce a Newick tree.
What tree building software do you recommend?
RAxML (Stamatakis, 2014) is great, or if you need a quick and dirty tree try FastTree.
Theres some very long branches in my tree?
It's likely you have recombination. Roary doesn’t take recombination into account, so you will have to use a different method such as Gubbins (Croucher et al., 2014) which uses reads aligned to a reference genome. Do not use the output of Roary as the input to Gubbins, they are fundamentally incompatible. Another possibility is that you might have contamination from two closely related strains.
Is there a server I can upload my data to and get a pan genome back?
No. One of the big selling points of Roary is that it can run on your own machine in a reasonable amount of time. Sending genomic data across borders is fraught with danger (and slow). For example, what if your private data gets accidentally publicly released, or you accidentally send data that is contaminated with Human reads (illegal without proper safeguards in many countries)? One possible alternative is to use http://wgsa.net if you wish to visualize your samples in the context of other published samples.
Why is there a sudden increase in the core genome size every 100 genomes>
By default the definition of a core gene is that it is present in 99% of samples to account for the odd assembly error in large datasets. Since we operate with whole numbers (integers) when we talk about samples, it means that below 100 a gene must be present in all samples to be called core, between 100-199 samples it can be missing from 1 sample and still be called core, and so on. You can either use your favourite curve fitting algorithm in R to smooth things out, or you can increase the core definition (-cd) to 100% so a core gene must be present in all samples.
What does modifying the inflation value do?
The MCL inflation value is an interesting parameter because it can quite substantially change your clustering. It has been set to work with closely related species, so if you're working at a different level, you should consider changing this value. I can't tell you what a good value is, but there is documentation out there to help you on the mcl website.
The software produced no results, what do I do?
The first thing to check is you have enough memory and disk space. If you are providing thousands of diverse genomes, you will need a tens of GB of RAM. If memory is not a problem the next thing to check is the data itself. You may be shocked to hear this, but sometimes people dont QC their datasets and launch straight into largescale complex analysis wasting weeks/months/years of time. First off, never trust any data you download from the elsewhere or from published papers, always QC it ourself. Simple things to check include: is it the right species, is there contamination, was the coverage high enough for reasonable quality assemblies (30X), is there systematic bias in the reads, is the insert size distribution as expected, are the assemblies too big/small, are the assemblies too fragmented, are the number of genes too high/low, did your controls sequence and assemble as expected etc...? It might sound like a lot but they are quick to check. If you do run controls and QC your datasets, then feel free to contact us and we will do our best to help.
I have no knowledge of the command line or bioinformatics and have just spent $500,000 sequencing lots of bacteria. What do I do to get a pretty tree?
Hire a bioinformatician.
I haven’t done any QC on my sequencing data and the pan genome looks very strange?
garbage in = garbage out.
Will it work with Virus data?
In theory yes, just set the translation table to 1 (-t 1). I haven’t validated it so use at your own risk.
Will it work with Archaea?
Yes.
Will it work with Mitochondria or Mycoplasma?
Yes, just set the translation table to 4 (-t 4).
Will it work with Eukaryotes (e.g. Homo sapiens, Mus musculus)?
No. The software will not work with organisms which have introns/exons.
Will it work with Fungi?
No.
I get errors about missing core genes when aligning with PRANK?
PRANK hasnt been updated in a few years and requires an old version of MAFFT. Modifying your environment variables may help: UNSET MAFFT_BINARIES. Alternatively just run MAFFT instead of PRANK.
Do you have plans for a Windows version?
No plans, however there are reports of a lot of bioinformatics software running on Ubuntu for Windows 10, so let us know if it works.
My biologist boss says I must do my analysis in Windows? How can I use Roary?
Virtually all bioinformatics is performed using Linux/Unix/OSX, but the world of biology generally works in Windows (Microsoft Excel to be exact), which can lead to conflicting requirements. You need to choose the right tool for the job, so bite the bullet and use Linux. This can easily be done by renting a server in the cloud, or installing a virtual machine in Windows.
How much does the software cost?
£0, it's open source.
Is Roary available in Galaxy?
Yes, thanks to Simon Gladman, Roary is now available in the Galaxy toolshed.
Is Roary available in Homebrew?
Sort of. Homebrew has closed down most 'taps', such as homebrew-science, moving some software into the core and leaving the rest in unsupported third-party repositories. The probability of software working into the future is reduced, so we no longer recommend homebrew as an installation method. So it might work or it might not work, but you are on your own if you use this installation method, sorry but its out of our control.
Can you analyse my data for me?
No, sorry, but we already have a gazillion samples of our own to make sense of which should keep us occupied for the next while.
I'm going to be in the area, can I drop in for a coffee?
Sure, drop us a line. It's always a pleasure to talk to people interested in this obscure part of biology.
I can't get Roary working on my private dataset. Will you sign an NDA if I send it to you?
Only if it is agreed in advance with our legal department. Given the open science mission of the Wellcome Trust, we are likely to reject your request.
I sent you private data as part of a bug report and didn't tell you it was subject to an NDA. Will you retrospectively sign an NDA?
No.
My bacteria only has 1 gene, so why does Roary crash?
You are using the software for a purpose for which it was never designed with an artificial dataset.
Why wont you help me debug an issue on my version of Linux which as last updated 4 years ago?
If your running a really old upsupported version of Linux, many issues could be causing this software not to work, in addition to the probable security holes. So the first step should be to upgrade to a more modern operating system.
I downloaded a load of random assemblies from GenBank. Why am I seeing crazy results?
Gene prediction software rarely completely agrees, with differing opinions on the actual start of a gene, or which of the overlapping open reading frames is actually the correct one, etc. As a result, if you mix these together you can get crazy results. The solution is to reannotate all of the genomes with a single method (like PROKKA). Otherwise you will waste vast amounts of time looking at noise, errors, and the batch effect.
Roary outputs genes as nucleotides but I want proteins!
It is straightforward to convert a gene of nucleotides to amino acids. If you don't know how to do it, I would suggest doing a beginners course in bioinformatics, or read an introductory book, before undertaking more advanced analysis.
Roary throws lots of Python errors
You're trying to run a Perl program with Python. It's unlikely to work any time soon.
What are the alternatives to Roary?
If Roary doesn't suit your needs there are many other applications to create microbial pan-genomes such as: OrthoMCL, PanOCT, PanSeq, LS-BSR, FindMyFriends, PopPunk, MicroPan and PGAP. New applications come out weekly. Quality not guaranteed.
cdhit seg faults
Old versions of cdhit have a bug, so you need to use at least version 4.6.1. The cdhit packages for Ubuntu 12.04 seem to be effected, so installing from the source is the only option.
Use of uninitialized value in require at Encode.pm
If you see a warning like about the 'Use of uninitialized value' in Encode.pm, don't worry, it's just a warning and has no impact the script. If you want to get rid of this warning, just update the Encode perl module to the latest version.
Kraken installed via homebrew throws an error.
Theres a bug and you'll need to install it from source on older versions of OSX (like Mountain Lion).
Why don't you bundle a Kraken database for the QC?
It's massive (2.7GB currently) and changes as RefSeq is updated. The authors have prebuilt databases and details about how to make your own.